Trend followers made an average of 95% returns during the 2008 financial crisis while the market dropped 37%. When everyone else lost money, these investors profited by following one simple rule: ride trends wherever they go.
Trend following sounds simple. Buy what goes up. Sell what goes down. Yet this straightforward approach has outperformed most professional investors for decades. This strategy doesn’t predict market movements. It simply follows what’s already happening. Whether you manage millions or have a small account, the same principles apply.
This guide shows you exactly how trend following works, why it succeeds when other methods fail, and how to start using it yourself. You’ll learn the specific rules that separate profits from losses. You’ll discover why discipline matters more than intelligence. Most importantly, you’ll understand that successful investing doesn’t require complex theories or secret knowledge.
What Trend Following Really Means
Trend following means buying assets moving up and selling assets moving down. It sounds backwards to most people. Conventional wisdom says buy low and sell high. Trend followers do something different: they buy high and sell higher.
Here’s why this works. Stock ABC trades at $50 for months. Then it breaks above $50 and climbs to $60. A traditional investor waits for it to drop back to $50 before buying. A trend follower buys at $60 because the trend just confirmed upward. When price hits $80 and the trend breaks, the trend follower sells. They bought high and sold higher.
This strategy works across stocks, commodities, currencies, and bonds. The timeframe stretches from weeks to years. Some trend followers hold positions for months. Others hold for years. The key is following the trend, not the specific holding period.
The philosophy challenges decades of financial advice. But markets trend because of human behavior. Fear and greed create sustained price movements. Once a trend starts, it usually persists longer than most expect. Trend followers profit from this reality instead of fighting it.
The History Behind This Strategy
Commodity traders first developed trend following in the 1970s. They discovered that following price trends generated consistent profits. Richard Dennis, a famous trader, later conducted an experiment called the Turtle Traders in 1983. He taught ordinary people with no trading experience his trend following system.
The results shocked everyone. These beginners, trained for just two weeks, became millionaires. They proved that systematic trading could work for anyone willing to follow the rules. The study showed that intelligence and education mattered less than discipline and consistency.
Famous trend followers like John Henry and Bill Dunn built billion dollar fortunes using these principles. Their performance across multiple market cycles proved the strategy’s strength. These investors made money not just in good markets but during crashes too. Institutions now employ trend following because the track record is undeniable.
Why Trend Following Works When Others Fail
Markets trend because institutions move enormous amounts of money. When major funds decide to buy, their accumulation creates sustained price increases. When they sell, prices drop for extended periods. Individual emotional trading amplifies these movements.
Trends persist longer than most people expect. Investors expect prices to bounce back quickly. Instead, trends continue for months or years. By the time most people finally believe the trend exists, significant gains have already happened. Trend followers catch the meat of these moves.
The strategy removes emotion from decision making. Instead of wondering if you should hold or sell, you follow predetermined rules. When price crosses below your moving average, you sell. No second guessing. No hope. Just the plan.
Trend followers cut losses quickly and let winners run. Most investors do the opposite. They hold losers hoping for recovery and sell winners too early. Trend followers reverse this. Small losses plus large gains equals overall profit. This simple math works better than human intuition.
Something this simple succeeds partly because most people can’t follow the rules. When price drops, your first instinct is fear and selling. Trend following requires you to buy during rises when fear whispers that prices are too high. This psychological discipline is harder than any technical skill.
The Core Rules Every Trend Follower Uses
Rule 1: Only buy when price makes new highs or breaks above resistance. Don’t buy hoping for a reversal. Buy when the trend already started. This reduces false signals dramatically.
Rule 2: Cut losses fast with predetermined stop losses. Decide exactly where you’ll exit if wrong before entering. When price hits that level, you sell. No exceptions. No averaging down on losing positions.
Rule 3: Let profits run as long as the trend continues. Don’t take small profits and watch positions double without you. Use trailing stops to lock in gains while staying in winning trends.
Rule 4: Never average down on losing positions. If a position starts losing money, you don’t buy more to lower your average price. You exit according to your plan.
Rule 5: Use position sizing to manage risk. A smaller account needs smaller positions. The math is simple: never risk more than 1-2% of your total account on any single trade.
Rule 6: Follow the system without exception. The rules only work if you actually follow them. During boring sideways markets, you stay disciplined. During winning streaks, you don’t get reckless. Systems fail when people abandon them.
Moving Averages: The Foundation of Most Systems
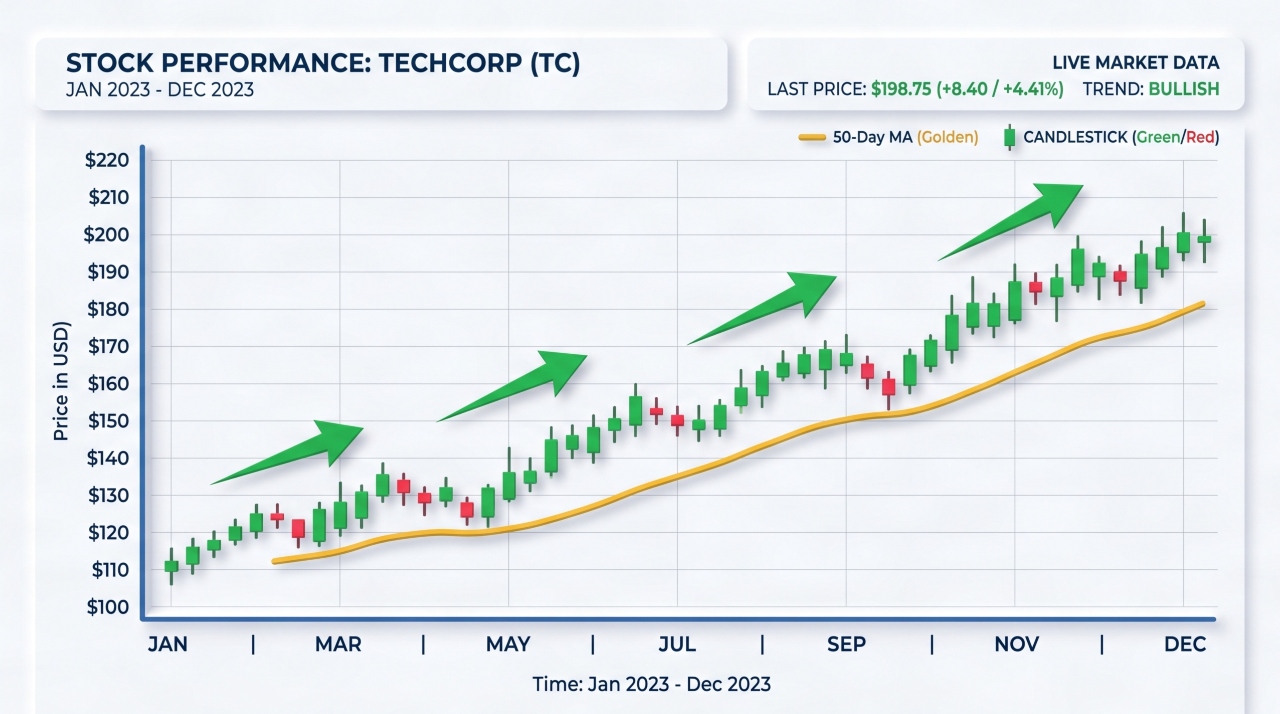
A moving average smooths price action to show the overall trend. The 50 day moving average averages the last 50 days of closing prices. The 200 day moving average looks at 200 days. These two are the most common.
When price trades above both moving averages, an uptrend exists. When price trades below both, a downtrend exists. When the 50 day crosses above the 200 day, this golden cross signals a new uptrend might be starting. A death cross occurs when the 50 day crosses below the 200 day, signaling downtrends.
Many trend followers enter long positions when price breaks above the 200 day moving average. They exit when price closes below the 50 day moving average. This simple two indicator system has generated profits for decades.
Moving averages have one weakness: they lag price action. You always enter and exit after the best moves. This is also their strength. The lag filter prevents you from trading every small wiggle. You catch substantial trends and ignore noise.
Breakout Trading: Another Trend Following Method
Breakouts occur when price moves above resistance levels that have held for extended periods. These breaks signal trend starts. When a stock trades in a narrow range for weeks then suddenly jumps higher with volume, a breakout is happening.
The 52 week high strategy exemplifies this approach. When a stock reaches its highest price in a year, it’s breaking out. Trend followers buy these breakouts. This strategy seems counterintuitive because you’re buying at extreme prices. Yet these breakouts often lead to extended trends.
Volume confirmation matters for breakout trading. A breakout on low volume is suspicious. A breakout on high volume is genuine. Big money is participating. When millions of shares trade above the breakout level, the trend has real strength.
False breakouts happen. Price breaks above resistance then reverses. Trend followers expect some losses. They use position sizing so false breakouts don’t hurt much. One false breakout losing 2% is acceptable when real breakouts gain 10%.
Position Sizing: How Much to Risk on Each Trade
Position sizing is more important than entry timing. Many traders focus on finding perfect entries. Smart traders focus on never losing too much on any single trade.
The math is straightforward. If your account has $10,000 and you risk 1% per trade, you risk $100. If the stock is at $50 and your stop loss is at $45, you risk $5 per share. Dividing $100 by $5 equals 20 shares maximum.
This means larger account distances to stops require smaller positions. If your stop is $10 away, you buy 10 shares instead of 20. The risk stays constant at $100. This protects your account during inevitable losing streaks.
Imagine a losing streak where 10 trades fail in a row. With 1% risk per trade, your $10,000 account drops to about $9,045. You’re still intact. You can recover. Many traders risk 5% per trade and lose their accounts on losing streaks half this length.
When to Enter a Trend Following Trade
Patience is essential. Wait for confirmation that a trend actually exists before entering. Anticipating trends leads to early entries and losses.
One entry method: wait for price to close above the 200 day moving average on high volume. This confirms an uptrend is starting. Another method: buy when the 50 day crosses above the 200 day. Both signal trend commencement.
A third approach uses breakouts. When price breaks above a resistance level that held for weeks, enter a position. Again, volume matters. High volume breakouts are genuine. Low volume breakouts often reverse.
Avoid catching falling knives. This phrase means buying stocks that are plummeting. A stock down 50% might look cheap, but it’s often a value trap. Trend followers ignore these situations. They only buy when price starts moving up, not when it’s collapsing.
When to Exit: Cutting Losses and Taking Profits
Stop losses protect you when wrong. Set a percentage stop like 8% below entry or a technical stop below support levels. When price hits this level, sell immediately. No hoping. No waiting. The plan is the plan.
Trailing stops lock in profits while keeping you in winning trends. As price rises, your trailing stop rises too. If you bought at $50 and price climbs to $70, move your stop from $46 to $66. If price drops back to $66, you sell but you’re still up $16.
Exit when the trend breaks. If you’re in an uptrend and price closes below the 50 day moving average, sell. The trend ended. Staying in hoping for a bounce rarely works. Moving to the next opportunity is wiser.
The hardest part of trend following is exiting winners too early. You’re up 5% and nervous it will disappear. You sell. Then the stock climbs 15% more without you. This regret is painful. Stick with your plan. Some exits will be early. Some will capture huge gains. Over time it balances.
What Markets Work Best for Trend Following
Trend following works across all liquid markets. Commodities historically show the strongest trends. Oil, gold, and agricultural products trend persistently.
Stock indexes trend better than individual stocks. The S&P 500 has fewer surprises than individual companies. Currencies trade 24 hours so you can follow Asian, European, and American trends continuously.
Cryptocurrencies have extreme volatility that suits trend following perfectly. Bitcoin trends for months at a time. The bigger moves generate excellent profits for trend followers willing to handle the swings.
Diversifying across multiple markets improves results. One market might be in a losing streak while another trends nicely. Trading multiple markets smooths returns and reduces drawdowns. Starting with one market is fine. Adding others over time makes sense.
Common Mistakes That Kill Trend Following Returns
Exiting winners too early destroys returns. You gain 5% and sell, then watch it go 15%. Stick with your exit plan. Some exits will be premature. Accept this as part of the process.
Holding losers too long does the same damage. You’re down 3% and feel like it might bounce. Instead it drops to 10% loss. Your predetermined stop loss prevented this pain. Follow it.
Overtrading takes small setups that don’t fit your system. Your rules say the trend must be confirmed. You enter anyway. Most of these trades lose money. Discipline means taking only high probability setups.
Ignoring position sizing ruins accounts. A trade goes wrong. Instead of 1% loss, you lose 5% because you broke the rules. One more mistake and another 5%. Your account shrinks quickly.
Changing systems during normal drawdowns kills potentially profitable strategies. Every system has losing periods. Your trend following system might lose for three months, then gain 20% over two months. If you abandoned it during the drawdown, you missed the gain.
Dealing With Losing Streaks and Drawdowns
Losing streaks are normal. A trend following system might win 55% of trades and lose 45%. This feels bad but creates profits when winners are bigger than losers.
Drawdowns of 20 to 30% happen in good systems. Your account grows from $10,000 to $12,000. Then a losing streak drops it to $8,400. This is a 30% drawdown. Psychological preparation matters. Knowing drawdowns will happen makes them easier to handle.
The math works like this: you have 40 losing trades of 1% each, losing $400. You have 30 winning trades of 3% each, gaining $900. Net result is a gain despite more losses than wins. Big winners trump numerous small losses.
Distinguish between normal drawdown and broken systems. Normal drawdown: losing streak followed by return to profits. Broken system: continuous losses across multiple market types. Review your system when the losses seem wrong. If the fundamentals still make sense, stay disciplined.
Backtesting Your Trend Following System
Backtesting means testing your system on historical price data. You apply your exact rules to past years of prices and see what would have happened. This builds confidence before risking real money.
Free tools like TradingView offer simple backtesting. Paid platforms like AmiBroker handle more complex systems. Either works for starting. Test your system on at least 10 years of historical data. Include bull markets, bear markets, and sideways years.
The goal isn’t finding a system with zero losses. That doesn’t exist. The goal is understanding expected returns, maximum drawdowns, and winning percentage. This knowledge helps you stay disciplined during tough periods.
Avoid curve fitting, where you tweak your system until it looks perfect on historical data but fails in real trading. Simple rules that work across different time periods beat complex rules that fit one specific market perfectly.
Building Your First Trend Following System
Start simple. One indicator. Clear entry rules. Clear exit rules. Complexity doesn’t improve returns. Most profitable trend followers use basic systems.
Here’s a complete beginner system: Buy when the 50 day moving average crosses above the 200 day moving average. Sell when price closes below the 50 day moving average. Risk 1% per trade using position sizing math. Track every trade in a journal.
Write down the exact rules before trading. When will you enter? When will you exit? How much will you risk? How many shares will you buy? This clarity prevents emotional decisions.
Start paper trading first. This means tracking trades without real money. Trade for one month following your exact rules. Do the results feel realistic? Does the system match your personality? Then open a small real account.
Time Commitment and Realistic Expectations
This strategy requires about 30 minutes per week for weekly timeframe systems. Longer timeframes need even less monitoring. You check positions once or twice weekly. Place orders if signals occur. That’s it.
Realistic returns average 15 to 25% annually over long periods. This beats buy and hold for most investors, but not every year. Some years you’ll gain 40%. Other years you might lose 10%. Patience and consistency matter.
Years with losses will happen. Three years of gains followed by one loss year is normal. The long term trend matters more than short term results. Investment duration of at least five years is advisable. Shorter periods mean you might exit during a temporary drawdown.
Trend Following vs Other Investment Strategies
Trend following differs from buy and hold investing. Buy and hold assumes markets always go up eventually. Trend following exits losing positions. Buy and hold keeps you invested through 50% declines. Trend following cuts losses at 8%.
Value investing seeks underpriced stocks. Trend following ignores valuations entirely. A stock might be cheap by every metric. Trend followers don’t care. If it’s not moving up, they’re not buying.
Day trading tries to profit from small daily price moves. Trend following ignores daily noise. A stock might drop 3% in a day but still be in a strong uptrend. Trend followers hold and ride the larger trend.
Each strategy fits different people and goals. Trend following suits people who want a systematic approach. It fits those willing to accept losses as part of profitable systems. It works for people wanting to trade across multiple markets.
Start Following Trends Today
Trend following succeeds because it removes emotion and replaces it with rules. Markets will trend. Humans will fear and greed themselves into losses. You profit by following the trends and managing risk.
The strategy seems simple because it is simple. Simplicity is actually the greatest strength. Complex systems break. Simple systems persist through decades of market changes.
Pick one market and one simple system this week. Stock index like the S&P 500 is perfect for beginners. Your system: buy when 50 day crosses above 200 day. Sell when price closes below 50 day. Write down your position sizing math. Test it on one year of historical data.
Paper trade for a month. Follow every rule exactly. Track results. If it feels sustainable and matches your personality, start with a small real position. The system only works if you work the system. Your first trend is waiting. All you need to do is follow it.