Every single day, millions of people check stock market charts before making investment decisions. Yet most of them are confused about what they’re looking at. The good news? Reading stock charts isn’t as hard as it seems. Once you learn the basics, you’ll spot patterns and trends that other beginners miss. This knowledge can help you avoid bad trades and catch good opportunities. Let’s break down the skills you need to become confident reading any stock chart.
What Are Stock Market Charts?
Stock charts are simple pictures that show how a stock’s price moves over time. Think of them like a movie of a stock’s journey. Instead of showing just one price at one moment, charts show how the price changes hour by hour, day by day, or month by month. They’re tools that help you see the big picture.
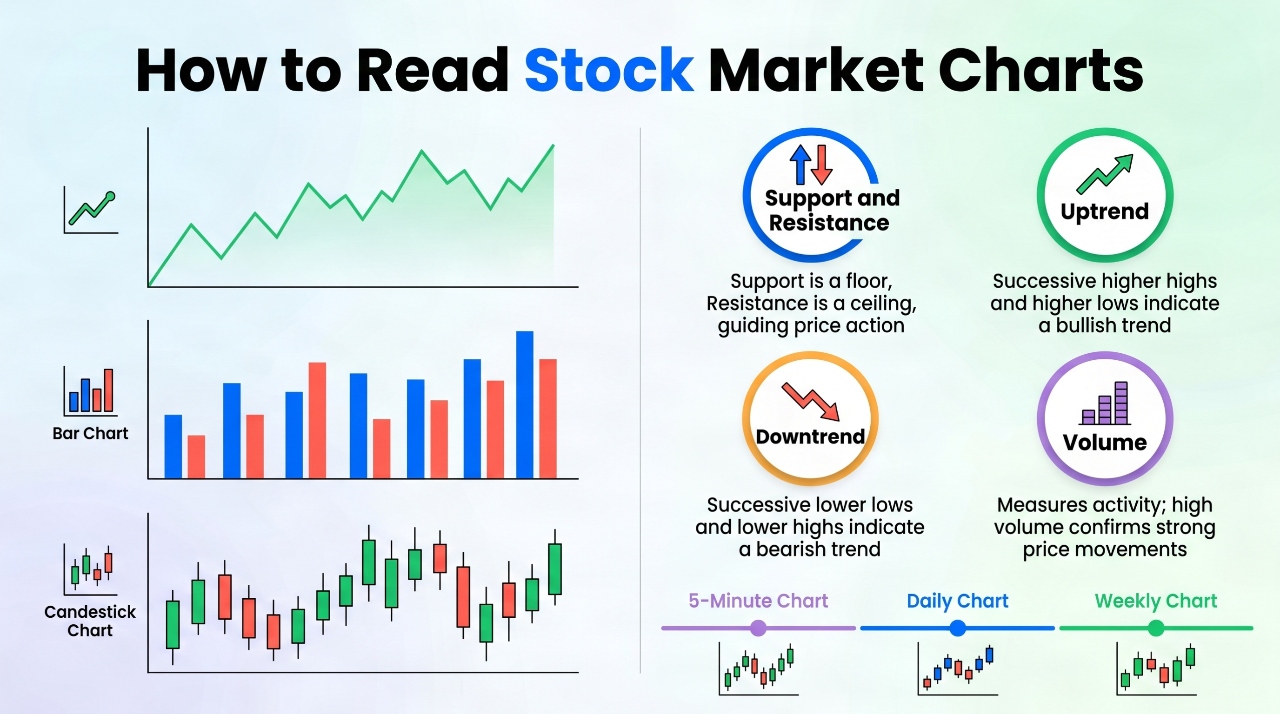
There are three main types of stock charts you’ll see: line charts, bar charts, and candlestick charts. Each type tells you slightly different information. Line charts connect dots that show closing prices. Bar charts show opening and closing prices plus high and low prices for each time period. Candlestick charts do the same thing but look more like little candles.
Charts also show other useful information like trading volume (how many shares traded) and technical indicators (special calculations that help predict price movement). You don’t need to understand every single detail right away. Start with the basics first.
Why Should You Learn to Read Stock Charts?
Making stock investment decisions without looking at charts is like driving without looking at the road. You might get lucky sometimes, but usually you’ll crash. Stock charts show you where prices have been and help you guess where they might go next. This information helps you buy low and sell high instead of doing the opposite.
Charts also help you spot when a stock is getting stronger or weaker. They show you support levels where prices tend to bounce back up, and resistance levels where prices tend to stop going higher. Knowing these levels lets you set better entry and exit points for trades.
People who read charts well make better decisions about timing. Timing matters hugely in investing. Buying a good company at the wrong time can still lose you money. Charts help you spot the right time to buy or sell.
[Internal Link Suggestion: Link to “Stock Market Basics for Beginners” if available]
Understanding Candlestick Charts
Candlestick charts are the most popular way to view stocks because they show the most information in a small space. Each candlestick represents one time period, which might be one minute, one hour, one day, or one week depending on which chart you’re looking at. Let’s break down what each candle tells you.
Each candlestick has a body and two wicks (or shadows). The body shows the opening price and closing price for that time period. If the body is green or white, the stock closed higher than it opened (good news). If the body is red or black, the stock closed lower than it opened (bad news). The top wick shows the highest price reached during that period. The bottom wick shows the lowest price reached. Together, these parts paint a picture of how buyers and sellers battled during that time.
A tall thin candle means prices moved a lot but ended up close to where they started. A short fat candle with long wicks means there was huge disagreement between buyers and sellers. A short fat candle with no wicks means the price stayed steady. Learning to read what each candle shape means takes practice but gets easier quickly.
The color coding is simple. Green candles show strength. Red candles show weakness. When you see more green candles in a row, the trend is up. When you see more red candles in a row, the trend is down. Mix green and red means the stock is undecided about direction.
Reading Line Charts and Bar Charts
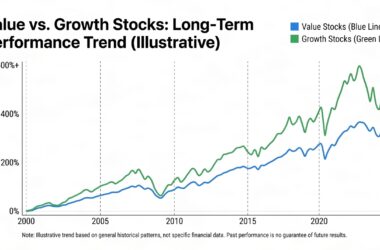
Line charts are the simplest type of stock chart. They just show one line connecting closing prices from one period to the next. This line shows the general direction clearly. If the line goes up and to the right, the stock is gaining value. If it goes down and to the right, the stock is losing value. Line charts are good for seeing the big picture without getting confused by daily ups and downs.
Bar charts show more detail than line charts but less than candlestick charts. Each bar represents one time period like a day or week. The top of the bar shows the highest price that period. The bottom shows the lowest price. A small mark on the left side shows the opening price. A small mark on the right side shows the closing price. Bar charts work well when you want simple detail without the visual complexity of candlesticks.
Both line charts and bar charts work fine for beginners, but candlestick charts eventually become your best friend. Once you learn to read them, you’ll see patterns more easily than other chart types.
What Is a Trend and How Do You Spot One?
A trend is the general direction a stock price moves over time. Trends can go up, down, or sideways. Spotting trends is one of the most important skills in chart reading because traders make money by following trends. The old saying goes: the trend is your friend. This means stocks that are trending upward tend to keep going up, and stocks trending downward tend to keep going down.
Uptrends show higher highs and higher lows. Imagine climbing stairs. Each step goes higher than the last one. When you look at a chart with an uptrend, you see a pattern where each peak is higher than the previous peak, and each valley is higher than the previous valley. This pattern tells you that buying pressure is stronger than selling pressure.
Downtrends show lower highs and lower lows. This is like walking down stairs. Each step goes lower than the last one. In a downtrend, each peak is lower than the previous peak, and each valley is lower than the previous valley. This pattern shows that selling pressure is stronger than buying pressure. Downtrends can scare people, but smart traders can make money from them too.
Sideways trends happen when a stock price bounces between two levels without breaking out. The high stays near the same level. The low stays near the same level. This consolidation phase happens when buyers and sellers are balanced. Eventually a sideways trend breaks either up or down. That moment can be profitable if you’re watching for it.
The best way to spot a trend is to draw a simple line connecting the peaks or the valleys. If that line goes up, it’s an uptrend. If it goes down, it’s a downtrend. If it’s flat, it’s sideways. Don’t overthink it.
Support and Resistance: The Foundation of Chart Reading
Support and resistance are two of the most powerful concepts in chart reading. Support is a price level where the stock tends to stop falling and bounce back up. Resistance is a price level where the stock tends to stop rising and fall back down. These levels exist because of human psychology. Once traders see a stock bounce at a certain level multiple times, they remember it and trade based on it.
Support levels form when prices drop to a certain level, then bounce back up multiple times. Each time the price reaches that level, buyers step in and buy, pushing the price back up. This happens because traders see value at that price and don’t want to miss the opportunity. For example, if a stock keeps bouncing at $50 whenever it falls that low, $50 becomes a support level.
Resistance levels form when prices rise to a certain level, then fall back down multiple times. Each time the price reaches that level, sellers step in and sell, pushing the price back down. Traders worry that the stock won’t go higher and decide to sell before it falls. For example, if a stock keeps falling away from $100 whenever it rises that high, $100 becomes a resistance level.
The interesting part is that sometimes support and resistance flip. When a stock finally breaks through a resistance level, that level often becomes new support below. When a stock finally breaks through support, that level often becomes new resistance above. Understanding these levels helps you know when a stock is near important decision points.
[Internal Link Suggestion: Link to “How to Trade Support and Resistance” if available]
Moving Averages: Smoothing Out the Noise
Moving averages are lines you add to charts to smooth out price noise and see trends more clearly. Imagine looking at a stock price that jumps around like a crazy person every single day. The real trend gets lost in all the noise. A moving average solves this problem by calculating the average price over the last several days or weeks, then moving that calculation forward one day at a time.
The most common moving averages are the 50 day moving average and the 200 day moving average. The 50 day average shows the medium term trend. The 200 day average shows the long term trend. When price is above both moving averages, the stock is in a strong uptrend. When price is below both, the stock is in a strong downtrend. When price is between them, the stock is in transition.
Moving averages are not predictions. They just show you what has already happened in a smooth format. They lag behind current price action. Yet they work incredibly well because they show the overall direction clearly. Many traders use them as simple entry and exit signals. When price bounces off a moving average, traders often buy or sell at that moment.
You don’t need to understand the math behind moving averages. You just need to know that they help you see the big picture trend. Charts with moving averages added usually have less confusing up and down noise. This helps you make better decisions.
Volume: The Silent Signal of Strength
Volume measures how many shares traded during a certain time period. High volume means lots of traders were buying and selling. Low volume means few traders were interested. Volume tells you something that price alone doesn’t: how confident traders are about the move. A price jump on high volume is more important than a price jump on low volume.
When you see a price move happen on high volume, it means lots of people agree with that move. This makes the move more trustworthy and likely to continue. When you see a price move on low volume, few people agree with it. This makes the move less trustworthy and more likely to reverse.
Look at the volume bars at the bottom of most stock charts. When you see tall volume bars, many shares traded that day. When you see short volume bars, few shares traded. Smart traders watch volume closely when a stock breaks above resistance or below support. If the break happens on high volume, it’s probably real. If it happens on low volume, be suspicious.
Volume also helps you spot exhaustion. When a trend has been running for weeks, and suddenly volume drops while prices stop moving, exhaustion might be happening. The move might be losing steam. This is information you can use to plan your exit.
Chart Patterns That Signal Price Movement
Chart patterns are shapes that form on charts that tend to repeat before price moves in predictable directions. The human brain loves patterns. We see them everywhere, even where they don’t exist. In stock charts, some patterns are real and work well. Others are just random noise. Start with the most common and proven ones.
The head and shoulders pattern is one of the most reliable reversal patterns. It looks like a person’s head and two shoulders. The left shoulder is a peak. The head is a higher peak. The right shoulder is a lower peak than the head. When you see this pattern, it usually means the uptrend is ending and a downtrend is about to start. Traders sell when they see this pattern forming.
The double bottom pattern signals strength. It’s two valleys at roughly the same level. When price bounces from the second valley, it usually means the downtrend is over and a new uptrend is starting. This is where traders start buying.
The triangle pattern forms when price action narrows over time. The peaks and valleys get closer together forming a shape like a triangle. Eventually price breaks out either up or down. Usually it breaks in the direction of the previous trend. Traders wait for the break then jump on the move.
Don’t rely on patterns alone. Look at volume, trends, and support and resistance too. Good traders use multiple signals together instead of betting on just one pattern.
Timeframes: Why They Matter for Your Strategy
The timeframe you choose to look at changes what you see. A stock that looks like it’s in a strong uptrend on a daily chart might look like it’s consolidating on a weekly chart. A stock that looks weak on a 5 minute chart might be in a strong uptrend if you zoom out to the daily chart. Timeframe matters hugely.
Short term traders look at 5 minute, 15 minute, or hourly charts. These timeframes show quick movements perfect for trades that last minutes or hours. Medium term traders look at daily charts. These timeframes work for trades lasting days or weeks. Long term investors look at weekly or monthly charts. These timeframes work for positions held for months or years.
Smart traders use multiple timeframes together. They might look at a weekly chart to spot the long term trend, then look at a daily chart to find the exact entry point. This approach takes the best of both worlds. The weekly chart keeps you trading in the right direction. The daily chart keeps you from entering too early or too late.
Never make trading decisions based on just one timeframe. What looks like a strong buy on a 5 minute chart might be a trap if the daily trend is down. Always check multiple timeframes before trading.
[Internal Link Suggestion: Link to “Day Trading vs. Long Term Investing” if available]
RSI and Other Popular Indicators
The Relative Strength Index (RSI) is an indicator that measures momentum. It tells you whether a stock is overbought (gone up too much too fast) or oversold (gone down too much too fast). RSI values range from 0 to 100. Values above 70 suggest overbought conditions. Values below 30 suggest oversold conditions.
When RSI is above 70, the stock might be due for a pullback. When RSI is below 30, the stock might be due to bounce. You can use this information to know when to buy the dip or sell the bounce. RSI works best in sideways markets. In strong trends, RSI can stay overbought or oversold for weeks. Many traders use RSI as a filter to confirm other signals.
MACD is another popular indicator that shows momentum and trend direction. Stochastic indicators show how close the current price is to the high and low of a range. Each indicator has strengths and weaknesses. You don’t need to understand them all at once. Start with moving averages and RSI, then add more indicators as you gain experience.
The key to using indicators is not to trust them blindly. They’re tools that help you, not magic formulas. Many indicators lag behind price action. Use them to confirm what you already see in the price and volume. Combine multiple signals rather than relying on one indicator alone.
How to Practice Reading Charts Without Real Money
Before you risk real money, practice reading charts for free. Many websites offer free charts with real stock data. TradingView offers excellent free charts. You can also look at charts on brokerage websites like Fidelity or Charles Schwab. These platforms teach you nothing new but give you live data.
Print out some historical charts and analyze them. Mark the support and resistance levels. Draw trend lines. Identify the patterns. Then check what actually happened in the weeks that followed. This paper trading approach teaches you how to read charts without risk.
Create a chart journal. Every day for a month, pick one stock. Draw the chart in your journal. Mark support, resistance, and trends. Write down what you think will happen. Then check the next day and see if you were right. Over time, your accuracy improves tremendously. This exercise costs nothing but teaches everything.
Watch how different stocks behave. Some stocks trend smoothly. Others bounce around sideways for weeks. Some stocks have clear support and resistance. Others seem random. Learning these different personalities helps you choose which stocks to trade and which ones to avoid. Different stocks need different strategies.
Common Mistakes New Chart Readers Make
New traders often jump to conclusions too quickly. They see one pattern and assume the stock will move a certain way. They ignore volume. They ignore the long term trend. They use only one timeframe. Then they’re shocked when the stock does the opposite of what they expected. Slow down and look at multiple signals before deciding.
Another common mistake is using too many indicators. Traders add moving averages, RSI, MACD, Stochastic, Bollinger Bands, and ten other indicators to one chart. The chart becomes a confusing mess. Simple is better. Three good signals beat thirty indicators fighting each other. Start simple and add complexity only if it helps.
Many traders also ignore risk management. They see a good setup and buy without knowing where they’ll sell if things go wrong. They don’t set stop losses. When the stock moves against them, they hold hoping it bounces back. Often it doesn’t. Always know before you buy where you’ll sell if wrong. This simple rule prevents huge losses.
Finally, traders sometimes force trades that aren’t there. They wait for a setup, but instead of waiting for the perfect moment, they enter early or late. They want action so badly they take bad trades. The best traders know when to hold and when to fold. They take only the highest quality setups.
Real Life Examples: Reading Charts in Action
Let’s look at a real scenario to put this together. Imagine a stock that’s been rising for three months. The uptrend is clear with higher highs and higher lows. The price is above both the 50 day and 200 day moving averages. Support is around $45. Resistance is around $55. The stock bounces to $52 and you’re thinking about buying.
Before you buy, check volume. Is volume high on the recent rallies? That shows confidence. Check RSI. Is it below 70? That means it’s not overbought yet. Check the daily chart. Is it still in an uptrend? Look at the weekly chart too. Does the long term trend confirm the daily trend? Only after checking all these signals should you consider buying at $52 with a stop loss at $44 just below support.
Now imagine a different stock that’s been falling for two months. Lower lows and lower highs show a downtrend. The price is below both moving averages. The stock has bounced at $30 three different times over the past month. That $30 level is now strong support. The stock falls to $30 again and you wonder if it’s finally time to buy and ride it back up.
This time, check volume on the bounces. Is volume low on the bounces? That shows weak buying interest. Check RSI. Is it below 20? Maybe the downtrend is slowing. But check the daily chart. Is it still making lower lows? Does the weekly chart show this downtrend is expected to continue? Only if you see weakness in the downtrend itself should you consider buying. If the downtrend looks strong, wait for clearer reversal signals.
Building Your Chart Reading Skills Over Time
Learning to read charts is a skill like learning to play guitar. You won’t be good immediately. You’ll sound terrible at first. But with daily practice, you improve. After six months of serious study, you’re decent. After a year, you’re good. After years, you’re excellent.
Start by looking at just one stock every day for a month. Get to know its personality. See where it bounces. Watch how it behaves during big market moves. Notice which patterns work on this particular stock. Different stocks have different personalities. Some are smooth. Some are choppy. Some respect round numbers like $50. Some don’t.
Then expand to looking at several stocks. This teaches you that each stock is different. What works perfectly for Stock A might not work for Stock B. Look at charts in different industries. Tech stocks move differently than utility stocks. Growth stocks move differently than dividend stocks. As your knowledge builds, you start to see why different stocks move differently.
Trade small amounts once you’re comfortable. Take maybe five or ten trades using real money but risking a small amount on each one. This teaches you lessons that paper trading can’t. Real money feels different. Your emotions change. You make mistakes under pressure that you never made while practicing. Small real trades teach you about yourself as a trader.
Keep notes on every trade. What did you see in the chart? Why did you enter? Why did you exit? Did the pattern work as expected? What would you do differently next time? These notes become your reference library. Over time, patterns emerge. You start seeing what works for you and what doesn’t.
[Internal Link Suggestion: Link to “Developing Your Trading Journal” if available]
The Relationship Between Charts and Fundamentals
Some traders use only charts and ignore everything about the company. Others ignore charts completely and focus on fundamentals like earnings and profit. Both approaches miss something important. The smartest traders blend both.
Charts show what traders think right now. Fundamentals show what’s really happening in the company. A company might have great earnings (good fundamentals) but the stock could be way overvalued (bad chart). You might wait for a better price. Another company might have weak fundamentals but the stock broke out above resistance (good chart signal). You might wait for fundamentals to catch up before buying.
Charts and fundamentals should point the same direction ideally. If fundamentals are strong and charts are showing uptrends, it’s a good buy signal. If fundamentals are weak and charts are showing downtrends, it’s a good sell signal. If fundamentals are strong but charts are downtrending, wait. If fundamentals are weak but charts are uptrending, be careful. Fundamentals might be the reason the uptrend reverses soon.
The relationship between these two approaches is important. Technicians (chart readers) often miss big changes in company health. Fundamental analysts (business analysts) often miss good timing to enter and exit. Blending both approaches gives you power.
Different Market Conditions Change Everything
Bull markets are when stocks are rising overall. In bull markets, trends are usually upward and support levels are more reliable than resistance levels. Downtrends have trouble sticking. This is the easiest environment for making money as a trader. You can almost buy anything and it goes up.
Bear markets are when stocks are falling overall. In bear markets, trends are usually downward and resistance levels are stronger than support levels. Uptrends have trouble sticking. This is the hardest environment for new traders. The shortcuts that worked in bull markets stop working.
Sideways or choppy markets are frustrating for trend followers. Bounces look like breakouts. Moves stop and reverse. Support and resistance levels are less reliable. Indicators get too many false signals. Many traders stop trading during sideways markets and wait for clearer trends.
The best traders adapt their strategy to market conditions. In bull markets, they can be aggressive and hold longer. In bear markets, they take profits faster and use shorter timeframes. In choppy markets, they either sit on the sidelines or use range trading techniques. Read the market conditions before reading individual stocks. That sets the stage for everything else.
Tools and Platforms for Reading Charts
You need access to good charts to practice and trade. Many free options exist. TradingView offers excellent free charts with most features you’ll need. StockCharts is another strong free option. Yahoo Finance shows basic charts for free. Your brokerage probably offers charts too.
Paid platforms offer more features, faster data, and better tools. Interactive Brokers has advanced charting. Thinkorswim from TD Ameritrade has powerful charting tools. These platforms cost money but aren’t extremely expensive if you’re serious about trading. Some have free trials so you can test them.
The specific tools matter less than developing good skills. You can read charts on any platform. It’s your eyes and brain that matter most. Learn the fundamentals using free tools. Once you’re skilled, upgrade to paid tools if you want advanced features. A great trader with free tools beats a beginner with expensive tools every time.
The Mental Game: Emotions While Reading Charts
Reading charts perfectly means nothing if you can’t control your emotions when trading. Fear and greed are your biggest enemies as a trader. You might see a perfect buy signal but fear stops you from entering. Then the stock shoots up and you kick yourself. Or you enter a perfect setup but panic when it moves against you slightly, and you exit right before it bounces back.
Fear makes you miss good trades. It makes you take profits too early. Greed makes you hold winners too long hoping for even more. It makes you take losses slowly hoping they bounce back. The chart tells you what to do, but your emotions fight the chart. Managing emotions is the hardest part of chart reading.
One way to handle emotions is to follow rules strictly. Write down your rules. Your rules might say: only buy when price is above the 50 day moving average, and only sell when price breaks below support. Make the rule so clear that emotions can’t interfere. You’re just following the rule like a robot.
Another way is to trade small. When you risk small amounts, losses don’t hurt as badly. You make better decisions. As you improve, you can risk more. Many successful traders started risking just pennies per share. They got good without losing much money. Then they scaled up size.
Conclusion: Your Path Forward
Reading stock charts is a learnable skill. You’re not born knowing it. But with practice and patience, anyone can become competent. Start with the basics: uptrends, downtrends, support, and resistance. Add candlestick patterns. Learn moving averages. Study volume. Then add indicators like RSI. Progress slowly and build your knowledge.
The biggest advantage you have is time. Markets have been around for hundreds of years. The same patterns repeat over and over. Millions of traders have studied these patterns. Books, videos, and courses teach you what they learned. You don’t need to discover everything yourself. Stand on the shoulders of giants.
Practice reading charts every single day for the next month. Pick one stock and study it deeply. Mark the levels. Draw the trends. After a month, you’ll see patterns forming. You’ll start predicting what happens. Your confidence grows. Your accuracy improves. This momentum carries you forward.
Remember that losing trades will happen. Even the best traders lose sometimes. What matters is your win rate and your risk management. If you win more trades than you lose, and you risk small amounts when you’re wrong, you make money over time. The charts tell you the story. You just have to read it correctly.
Start practicing today. Visit TradingView or another chart site. Pick a stock. Study it. Make predictions. Check back in a week and see if you were right. This costs nothing but time. After a month of daily practice, you’ll have skills most people never develop. After a year, you’ll understand stock charts better than most traders. After years, you might be the one teaching others.
The path is clear. The tools are free. The knowledge is available. All you need to do is start. Your first step is looking at a real chart right now. Open your browser. Find a stock. Look at its chart for ten minutes. That’s where your journey begins.