Between 2007 and 2022, growth stocks beat value stocks by more than 200%, but that’s not the whole story. In the first two years of the 2020s, value stocks came roaring back and crushed growth stocks by 30%. These wild swings make investors lose sleep at night, wondering if they picked the wrong strategy.
You want to know which type of stock will grow your money faster. This article shows you real performance data between value and growth stocks over different time periods. You’ll see how these two investing styles perform during good times and bad times. More importantly, you’ll learn when each strategy works best so you can make smarter choices with your money.
Picking between value and growth stocks affects how much money you’ll have in 10, 20, or 30 years. The difference can mean retiring early or working longer than you want. Charts help you see patterns that words alone can’t explain, and the data might surprise you.
What Are Value Stocks and Why People Buy Them
Think of value stocks like finding a $100 bill on sale for $70. These are shares of companies trading below what they’re really worth. The market hasn’t recognized their true value yet, but smart investors believe it will eventually.
Value stocks usually have low price to earnings ratios, which means you pay less for each dollar of profit the company makes. These businesses are typically established companies that have been around for decades. They often pay regular dividends, putting cash in your pocket every quarter.
Companies like Berkshire Hathaway, Johnson & Johnson, and Procter & Gamble represent classic value stocks. They sell everyday products people need regardless of the economy. Their stock prices don’t jump around as much as younger, flashier companies.
Investors choose value stocks because they want safety and steady income. The dividends provide regular cash flow, and the established business models mean fewer surprises. You’re buying solid companies at bargain prices and waiting for other investors to realize what you already know.
What Are Growth Stocks and Why They Attract Investors
Growth stocks work differently. You’re paying a premium price today for something that could be worth much more in the future. These companies are expected to grow their sales and profits faster than average businesses.
Growth stocks typically have high price to earnings ratios because investors are willing to pay more for faster growth. These companies rarely pay dividends since they reinvest every dollar back into the business. They’re building something big and need all their cash to fuel expansion.
Apple, Amazon, Tesla, and Netflix are famous growth stocks. They create new markets or completely change existing industries. Their stock prices can double in a year or drop 50% just as fast.
People buy growth stocks because they want their money to grow quickly. A $10,000 investment can turn into $50,000 or more if the company succeeds. The excitement of owning the next big thing also appeals to many investors who want to participate in the future of technology and innovation.
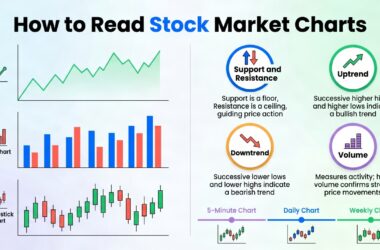
How Performance Charts Show You the Real Story
Stock performance charts measure total returns, which include both stock price gains and dividends paid. This matters because value stocks often deliver more of their returns through dividends while growth stocks deliver through price increases. A fair comparison must count both.
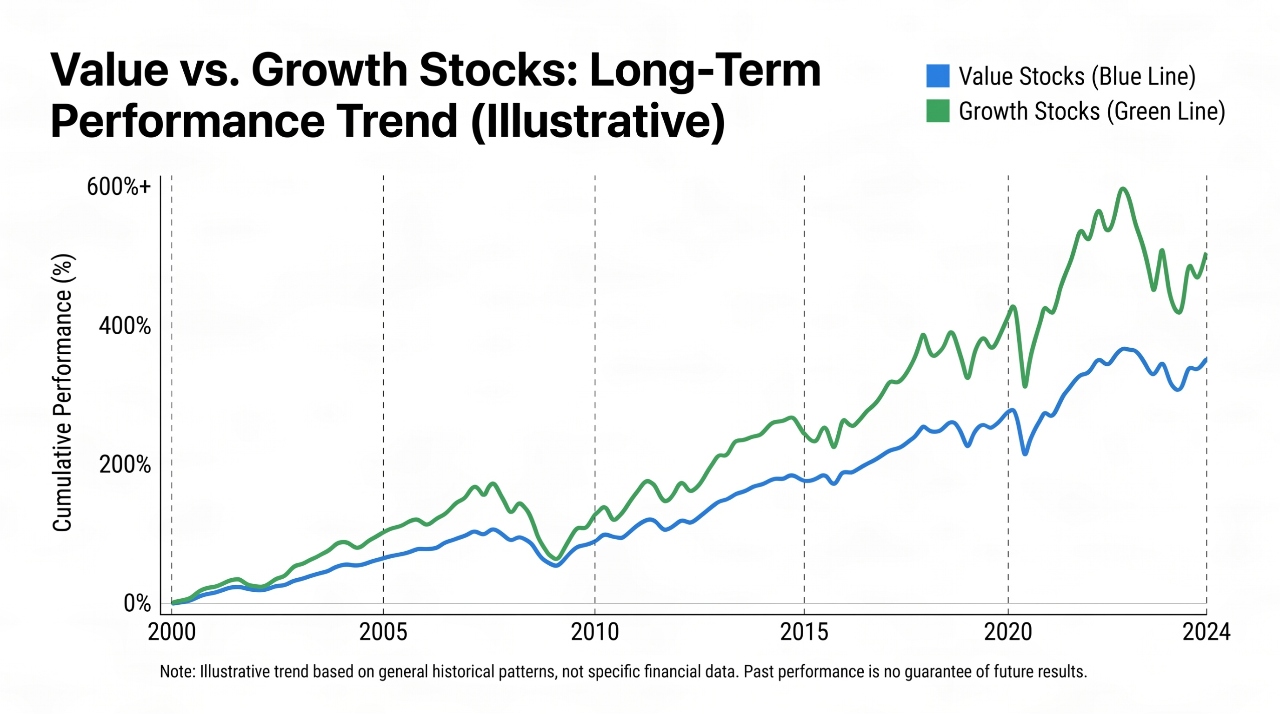
Reading a value vs growth stocks performance chart is simple. You’ll see two lines moving up and down over time. When the growth line sits above the value line, growth stocks are winning. When value climbs higher, value stocks are beating growth.
Charts matter more than opinions because numbers don’t lie. Someone can tell you growth always wins or value always wins, but a chart shows you what actually happened. The visual proof cuts through all the noise and predictions.
The time period you examine changes everything. A one year chart might show growth crushing value, while a 20 year chart tells a completely different story. The starting and ending points of your chart can make either strategy look like a winner, which is why you need to check multiple time frames before making decisions.
The Last 10 Years: Growth Stocks Dominated
From 2013 to 2023, growth stocks absolutely dominated the stock market. The Russell 1000 Growth Index returned about 15% annually during this period, while the Russell 1000 Value Index returned roughly 10% per year. That 5% gap compounds into massive differences over a decade.
Several factors created a perfect environment for growth stocks. Interest rates stayed near zero for years, making future earnings more valuable than current profits. Tech companies expanded into every part of our lives, from how we shop to how we work. The COVID pandemic accelerated digital adoption by years in just months.
The mega cap tech stocks led the charge. Apple grew from a $500 billion company to over $3 trillion. Amazon dominated online shopping and cloud computing. Netflix changed how we watch TV, and Tesla made electric cars cool.
Value stocks still made money during this decade. Banks, energy companies, and consumer staples didn’t lose money. They just couldn’t keep up with the explosive growth of technology stocks. A 10% annual return beats inflation and builds wealth, but watching growth investors make 15% stings.
The Last 20 Years: A More Balanced Picture
Looking back to 2003 changes the value vs growth stocks performance chart significantly. The gap between the two strategies narrows considerably when you include the early 2000s and the 2008 financial crisis.
The dot com bubble burst from 2000 to 2002 crushed growth stocks. The NASDAQ fell over 75% from its peak as internet companies with no profits went bankrupt. Value stocks held steady or even gained ground during this period because investors fled to safe, profitable businesses.
The 2008 financial crisis hit both value and growth stocks hard, but value recovered faster. Banks and financial companies, typically classified as value stocks, got destroyed during the crisis. However, the established businesses with real earnings and dividends bounced back quicker than speculative growth companies.
Different decades favored different styles throughout this 20 year period. Growth won the 2010s decisively. Value performed better in the early 2000s. The lesson here is that time period selection matters enormously when comparing these strategies.
Historical Performance Since 1926: What Nearly 100 Years of Data Reveals
Academic research by professors Eugene Fama and French research returns going back to 1926. Their findings showed that value stocks beat growth stocks over the very long term by about 3% to 5% per year. This edge became known as the “value premium.”
Buying cheap companies has historically added extra returns to your portfolio over decades. The research looked at thousands of stocks across nearly a century. The conclusion seems clear: value wins if you wait long enough.
However, value didn’t win every decade. Growth stocks had extended periods of outperformance, including the 1990s tech boom and the 2010s. The value premium played out over 30 to 50 year periods, not over months or even years.
Most people don’t invest for 100 years, which makes shorter periods relevant. You might have 30 years until retirement, and picking the wrong strategy for those specific 30 years matters to your lifestyle. The historical data provides guidance, not guarantees.
Historical Performance by Decade:
| Decade | Value Stock Returns | Growth Stock Returns | Winner |
|---|---|---|---|
| 1930s | -1.5% annually | -4.5% annually | Value |
| 1940s | 9.2% annually | 8.8% annually | Value |
| 1950s | 16.5% annually | 15.1% annually | Value |
| 1960s | 8.1% annually | 11.3% annually | Growth |
| 1970s | 10.5% annually | 5.6% annually | Value |
| 1980s | 15.8% annually | 13.2% annually | Value |
| 1990s | 14.6% annually | 18.3% annually | Growth |
| 2000s | 5.6% annually | -2.3% annually | Value |
| 2010s | 11.6% annually | 16.8% annually | Growth |
| 2020s* | 8.4% annually | 7.2% annually | Value |
*2020s data through 2023 only
Why Value and Growth Take Turns Winning
The market operates in cycles, with money rotating between value and growth stocks. Neither strategy wins all the time because economic conditions constantly change. What works great in one environment fails miserably in another.
Value stocks perform better when interest rates rise, inflation returns, or recession fears spread. Higher interest rates make dividend payments more attractive compared to waiting for future growth. Inflation hurts unprofitable growth companies that need cheap money to fund their expansion. During recessions, investors want established profitable businesses they can count on.
Growth stocks thrive when interest rates stay low, the economy expands, or new technologies emerge. Low rates make future earnings valuable today, justifying high prices for fast growing companies. Economic expansions let people take more risk since they feel confident about the future. New technologies create entirely new industries where growth companies dominate.
Investor psychology drives these cycles as much as economics. People chase what’s working, piling into growth stocks after they’ve already soared or buying value after it’s outperformed. This trend following creates extremes in both directions. Eventually, prices get so out of whack that mean reversion kicks in and the cycle reverses.
Recent Performance Changes That Surprised Everyone
The year 2022 shocked the investing world. After growth stocks crushed value for over a decade, the tables turned violently. Value stocks beat growth stocks by nearly 30% that year, catching almost everyone off guard.
The Federal Reserve raised interest rates at the fastest pace in 40 years to fight 9% inflation. Everything that made growth stocks attractive suddenly reversed. Free money disappeared, making future profits less valuable. Investors wanted companies making real money today, not promises of profits years from now.
Specific examples showed the carnage in growth stocks. Meta (Facebook) dropped 70% from its peak. Tesla fell 65% despite growing car sales. Netflix lost two thirds of its value. Meanwhile, energy stocks soared as oil prices jumped, and bank stocks rallied as higher rates boosted their profits.
This reversal proves that even the smartest investors struggle to time these shifts. Countless experts predicted growth would keep winning right up until it didn’t. The value vs growth stocks performance chart can turn on a dime when conditions change.
Which Strategy Fits Your Goals and Timeline
Your age and timeline should drive your decision between value and growth stocks. Someone in their 20s with 40 years until retirement can handle the wild swings of growth stocks. They have decades to recover from crashes and benefit from long periods of growth outperformance.
A person five years from retirement needs a different approach. They can’t afford to lose 50% in a growth stock crash right before they need the money. Value stocks with steady dividends and lower volatility make more sense for shorter timelines.
Your income needs also matter. If you need money from your portfolio today to pay bills, value stock dividends provide regular cash. Growth stocks that pay no dividends force you to sell shares to generate income, which means selling low during market crashes.
Most investors should own both value and growth stocks in different proportions. A simple guideline suggests younger investors might hold 70% growth and 30% value, while older investors flip that to 30% growth and 70% value. Your personal situation matters more than any general rule, though. Risk tolerance, other income sources, and specific goals should shape your mix.
How to Use Performance Charts to Make Better Decisions
The biggest mistake investors make is chasing what just worked. They buy growth stocks after watching them soar for years, right before the inevitable reversal. Performance charts help you avoid this trap if you use them correctly.
Look for extremes in the value vs growth stocks performance chart. When growth has outperformed value for 10 straight years, history suggests a reversal may be coming. When one style gets extremely expensive compared to its historical average, that’s your signal to add more of the cheaper alternative.
Recency bias tricks your brain into thinking recent trends will continue forever. After watching growth stocks double and triple, it feels obvious that growth is superior. Charts showing longer time periods remind you that cycles always turn. What goes up eventually comes down, and what’s down eventually recovers.
Rebalancing your portfolio annually forces you to buy low and sell high. If growth stocks crushed value this year, you now own too much growth. Selling some winners and buying more value brings you back to your target mix. This simple discipline makes you buy what’s cheap and sell what’s expensive.
Common Mistakes People Lose Money On
Picking favorable start and end dates makes either strategy look superior. Someone showing you a chart starting in 2009 and ending in 2021 proves growth wins. Another person showing 2000 to 2010 proves value wins. Both are cherry picking data to make their point.
Many comparisons ignore dividends, which understates value stock returns significantly. A value stock paying 4% in dividends annually adds up to 40% extra return over 10 years. Charts showing only price appreciation miss this huge component of total return.
Comparing your individual stock picks to broad value or growth indexes sets you up for disappointment. The indexes include hundreds of stocks, spreading risk across many companies. Your five stock picks carry much more risk and may not perform like the overall category.
Fees and taxes eat your returns faster than you think. An actively managed growth fund charging 1% annually takes $10,000 from a $100,000 investment over 10 years. Frequent trading in your attempt to time value and growth cycles triggers taxes on every gain. Low cost index funds that you hold long term keep more money in your pocket.
Building Your Own Portfolio Using These Insights
Start with low cost index funds that track value and growth stocks separately. This approach gives you exposure to both strategies without picking individual stocks. You get instant diversification across hundreds of companies in each category.
The Vanguard Value Index Fund (VTV) and Vanguard Growth Index Fund (VUG) are solid choices. They charge less than 0.05% annually and track the broad market. Other options include the iShares Russell 1000 Value ETF (IWD) and iShares Russell 1000 Growth ETF (IWF). Any of these funds work fine for most investors.
Track your performance once per quarter, not every day. Checking your portfolio constantly leads to panic selling when growth or value has a bad month. Quarterly reviews give you enough information without the emotional roller coaster of daily swings.
Adjust your value and growth mix based on life changes, not market movements. Add more value stocks as you get older and need more stability. Shift toward growth if you get a raise and can handle more risk. Don’t change your strategy just because growth had a great year or value crushed it recently.
Your Next Steps with Value and Growth Investing
Performance charts clearly show that both value and growth stocks have their time to shine. Growth dominated the 2010s with incredible returns, but value has won over the longest time periods in history. Recent years reminded everyone that trends reverse when you least expect them to.
Neither strategy is always right or always wrong. The economic environment, interest rates, and investor psychology determine which one performs better in any given period. Trying to perfectly time the switches between value and growth fails even for professionals with armies of analysts.
The smart approach is owning both value and growth stocks in proportions that match your age, goals, and ability to handle risk. Charts help you see patterns and avoid buying high after something already soared. They also show you that patience pays off because the losing strategy eventually catches up.
Look at your portfolio today. Do you own any value stocks, any growth stocks, or both? Check the performance charts for the past 1, 5, and 10 years to see where we are in the cycle. Then decide if your current mix still makes sense for where you are in life.
Don’t make big changes based on one year’s performance. Make small adjustments based on your long-term goals and timeline. If you’re young, lean more into growth but keep some value for balance. If retirement is close, emphasize value but keep some growth to fight inflation.
The value vs growth stocks performance chart is your roadmap, but you decide the destination. Open your brokerage account and check what you actually own right now. Most people are surprised to find they accidentally went all in on one strategy without realizing it. A balanced approach helps you sleep better at night and builds wealth in all market conditions.
Start small if you’re new to this. Put half your stock money in a value index fund and half in a growth index fund. Watch how they perform differently over the next year. You’ll learn more from real money invested than from reading a hundred articles. The best education in investing comes from having skin in the game and paying attention to what actually happens with your dollars.